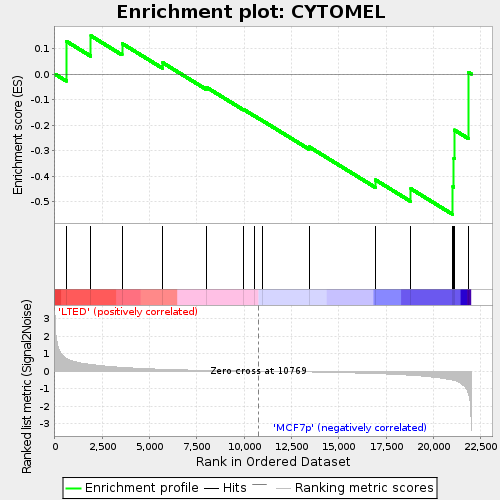
Profile of the Running ES Score & Positions of GeneSet Members on the Rank Ordered List
| Dataset | GE_agg.GE_agg.cls#LTED_versus_MCF7p.GE_agg.cls#LTED_versus_MCF7p_repos |
| Phenotype | GE_agg.cls#LTED_versus_MCF7p_repos |
| Upregulated in class | MCF7p |
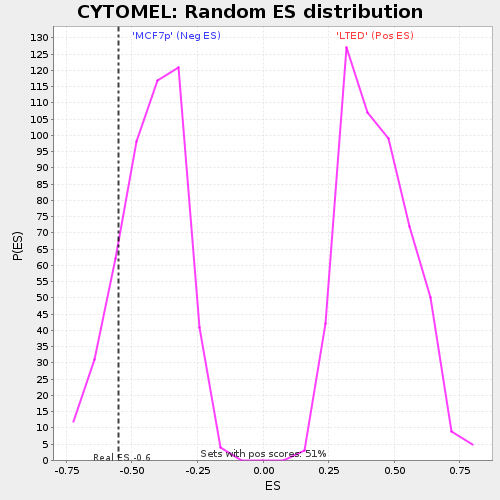
| GeneSet | CYTOMEL |
| Enrichment Score (ES) | -0.5501842 |
| Normalized Enrichment Score (NES) | -1.2928225 |
| Nominal p-value | 0.16255145 |
| FDR q-value | 1.0 |
| FWER p-Value | 1.0 |
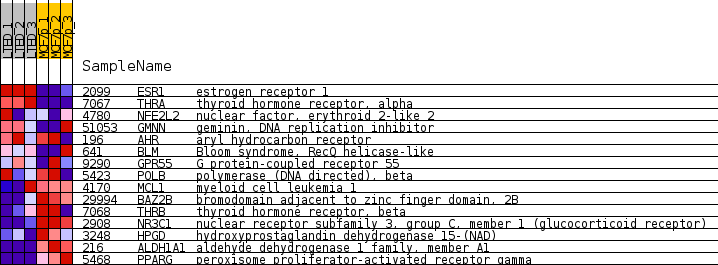
| PROBE | DESCRIPTION (from dataset) | GENE SYMBOL | GENE_TITLE | RANK IN GENE LIST | RANK METRIC SCORE | RUNNING ES | CORE ENRICHMENT | |
|---|---|---|---|---|---|---|---|---|
| 1 | 2099 | NA | ESR1 Entrez, Source | estrogen receptor 1 | 602 | 0.736 | 0.1285 | No |
| 2 | 7067 | NA | THRA Entrez, Source | thyroid hormone receptor, alpha | 1903 | 0.378 | 0.1495 | No |
| 3 | 4780 | NA | NFE2L2 Entrez, Source | nuclear factor, erythroid 2-like 2 | 3546 | 0.213 | 0.1199 | No |
| 4 | 51053 | NA | GMNN Entrez, Source | geminin, DNA replication inhibitor | 5703 | 0.105 | 0.0441 | No |
| 5 | 196 | NA | AHR Entrez, Source | aryl hydrocarbon receptor | 8000 | 0.043 | -0.0513 | No |
| 6 | 641 | NA | BLM Entrez, Source | Bloom syndrome, RecQ helicase-like | 9970 | 0.011 | -0.1385 | No |
| 7 | 9290 | NA | GPR55 Entrez, Source | G protein-coupled receptor 55 | 10543 | 0.003 | -0.1639 | No |
| 8 | 5423 | NA | POLB Entrez, Source | polymerase (DNA directed), beta | 10974 | -0.003 | -0.1829 | No |
| 9 | 4170 | NA | MCL1 Entrez, Source | myeloid cell leukemia 1 | 13429 | -0.046 | -0.2847 | No |
| 10 | 29994 | NA | BAZ2B Entrez, Source | bromodomain adjacent to zinc finger domain, 2B | 16946 | -0.142 | -0.4145 | No |
| 11 | 7068 | NA | THRB Entrez, Source | thyroid hormone receptor, beta | 18813 | -0.237 | -0.4492 | Yes |
| 12 | 2908 | NA | NR3C1 Entrez, Source | nuclear receptor subfamily 3, group C, member 1 (glucocorticoid receptor) | 21034 | -0.516 | -0.4409 | Yes |
| 13 | 3248 | NA | HPGD Entrez, Source | hydroxyprostaglandin dehydrogenase 15-(NAD) | 21086 | -0.528 | -0.3313 | Yes |
| 14 | 216 | NA | ALDH1A1 Entrez, Source | aldehyde dehydrogenase 1 family, member A1 | 21112 | -0.536 | -0.2190 | Yes |
| 15 | 5468 | NA | PPARG Entrez, Source | peroxisome proliferator-activated receptor gamma | 21841 | -1.224 | 0.0072 | Yes |